Asynchronous Call Graph
"Asynchronous Programming be like..."

How to use the ACG?
Open the call graph. Then press the sync/async button to toggle between modes. In async mode, the ACG reveals itself.
Examples
The Dbux intro video demonstrates the ACG in several examples.
Example1: sample program
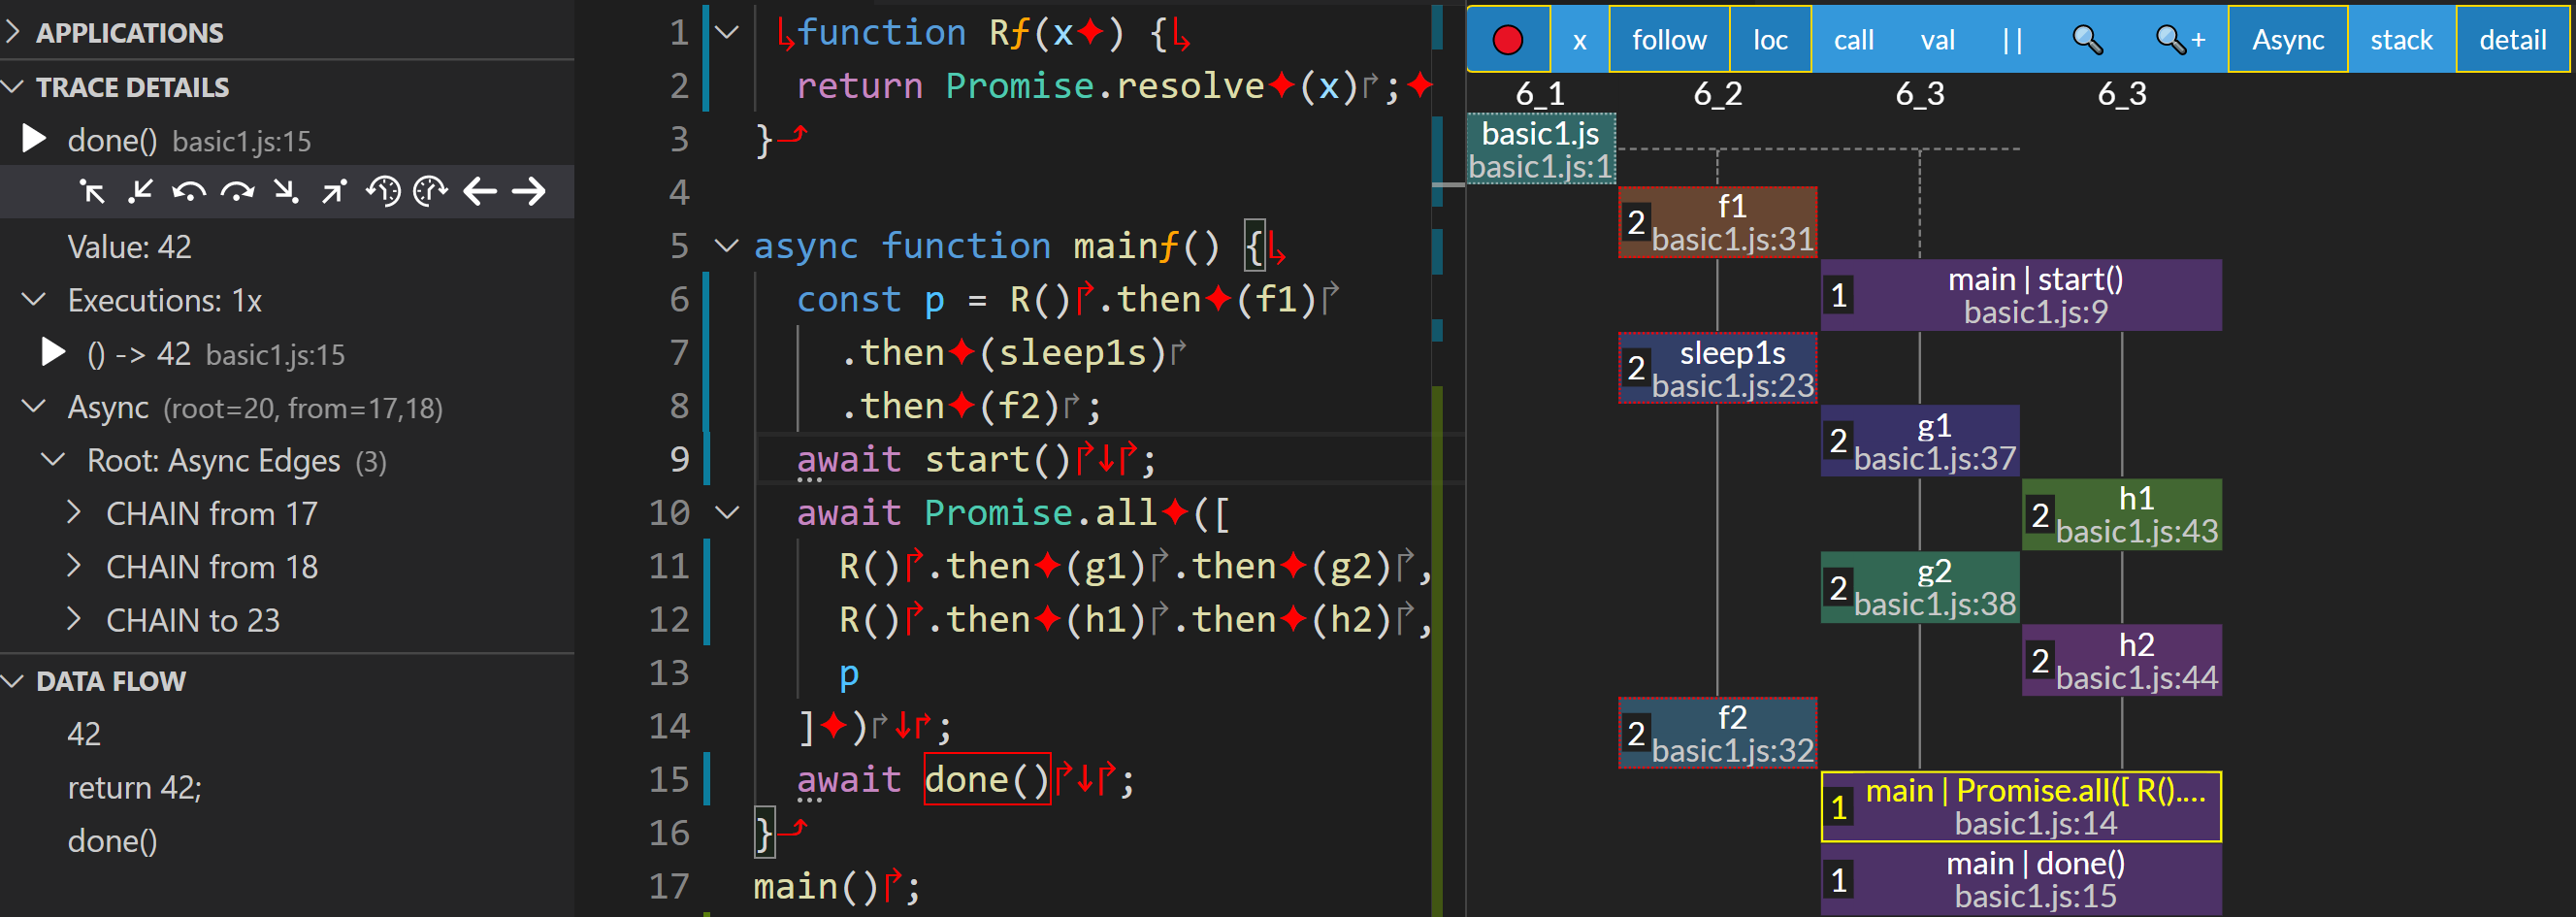
This example demonstrates the ACG of a sample program:

The ACG (right) renders the program CGRs❔ and the asynchronous event edges that connect them. The vertical axis is time (pointing downwards) and the horizontal dimension is a new experimental measure of "virtual threads" or "degree of concurrency".
- Code: The red solid border around the
done()call expression indicates that it is selected. - In the ACG, the
await Promise.all(...)node is also selected (due to follow mode), indicated by a yellow solid border.- → This means that
done()is in the CGR of that corresponding asynchronous continuation (or "virtual/resume context"). - → This also means that
done()'s CGR executed after the awaited promise settled.
- → This means that
- The dashed (red) border around the nodes on the left (
f1,sleep1s,f2) indicate that the selected node "synchronizes" against them.- → Those CGRs are part of a promise that scheduled earlier but had to finish before this root could start executing.
- Other observations:
f2will always followf1,g2will always followg1andh2followsh1.- The ACG also clearly shows that
f,gandhare executing concurrently. - → If someone wrote code requiring
hto always finish afterf, orgafterh, there might be a race condition because there is no such order assured in the code. That is why the ACG renders the three functions on separate "virtual threads" (vertical columns), illustrating that concurrency.
Example2: todomvc
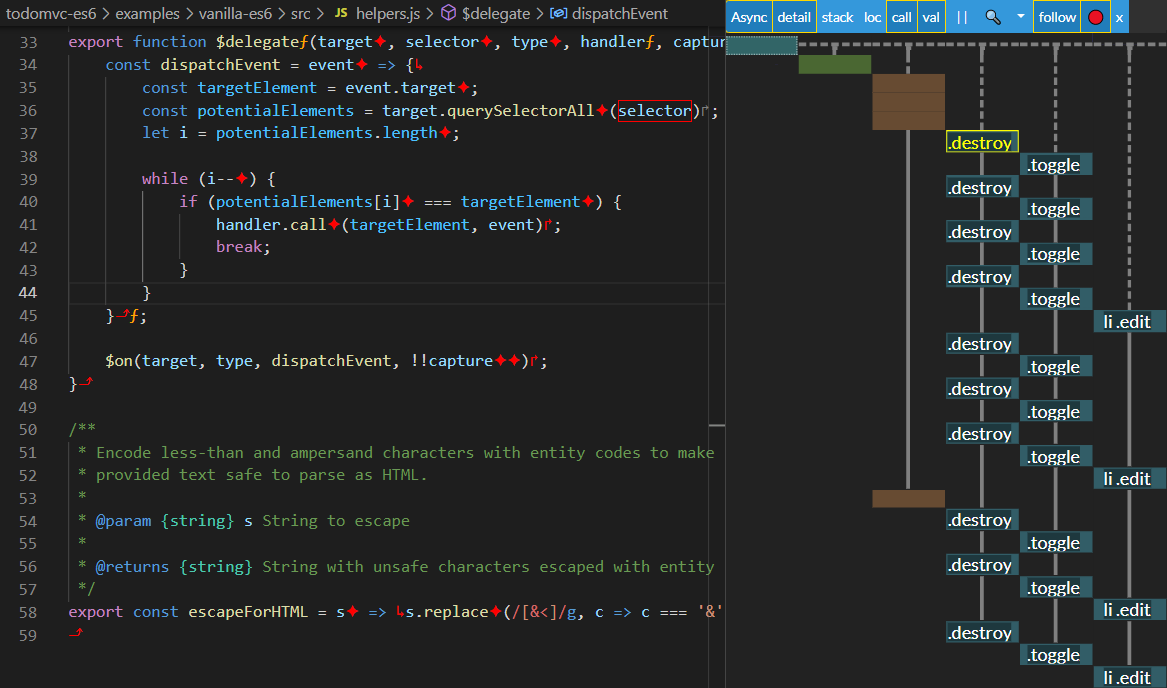
This example demonstrates the ACG of todomvc (vanilla-es6):

- In this example,
val(aka value mode) is enabled.- This option renders the value of the first execution of the currently selected trace in each CGR❔.
- In the ACG, we can see the value of
selectorfor each CGR❔, allowing us to see where/when the corresponding event (of this particular event handler) for each selector were handled. - We can click into each individual node to get us to the relevant execution of that event handler.
- NOTE: Event handler invocations of the same event are rendered in the same column.
Why do we need an ACG?
Asynchronous JavaScript and its relatives, parallel programming and concurrent computing, lead to much more complex execution pattern than their non-asynchronous, non-parallel, non-concurrent counterparts. In fact, asynchronous semantics are one of the most daunting aspects of JavaScript that software developers have to deal with on a day-to-day basis, making it feared by many, underestimated by the rest*.
With the ACG we hope to make asynchronous JavaScript a lot easier to understand and digest. It presents a clear picture of an application's asynchronous control flow, and makes many types of race conditions❔ visually obvious. It can also help uncover lacking error propagation and a lot more. For example, if your application's ACG has many individual columns, but a low level of actual concurrency (things don't actually happen concurrently), it might indicate that you (i) forgot to await or otherwise chain or nest your promises, or maybe (ii) are suffering from legacy code involving asynchronous callbacks and potential callback hell, that would benefit from re-writing using modern explicit asynchronous semantics.
How does the ACG work?
The Dbux introduction video features several examples of the Asynchronous Call Graph (ACG): direct link.
The Asynchronous Call Graph (ACG) is the call graph in Async mode. You can see the ACG by opening the call graph and switching to Async mode (by clicking the Sync button in the toolbar). The two call graph modes share many features, including the toolbar buttons, coloring and more, as explained here.
Sync mode allows inspecting children and children of children of file and function executions. However, it simply puts call graph roots❔ on a single linear vertical timeline. The ACG, on the other hand, uncovers the hidden connections between those roots on multiple vertical timelines and connections rendered between them.
In other words, Sync mode is great for inspecting control flow within individual call graph roots❔, while Async mode is great for inspecting control flow between them.
In many debugging scenarios, you probably want to toggle between the two modes, as you investigate the control flow of an application.
tip
For more in-depth technical information, consult our paper: An Asynchronous Call Graph for JavaScript (ICSE-SEIP, ACM, 2022).