Select Trace
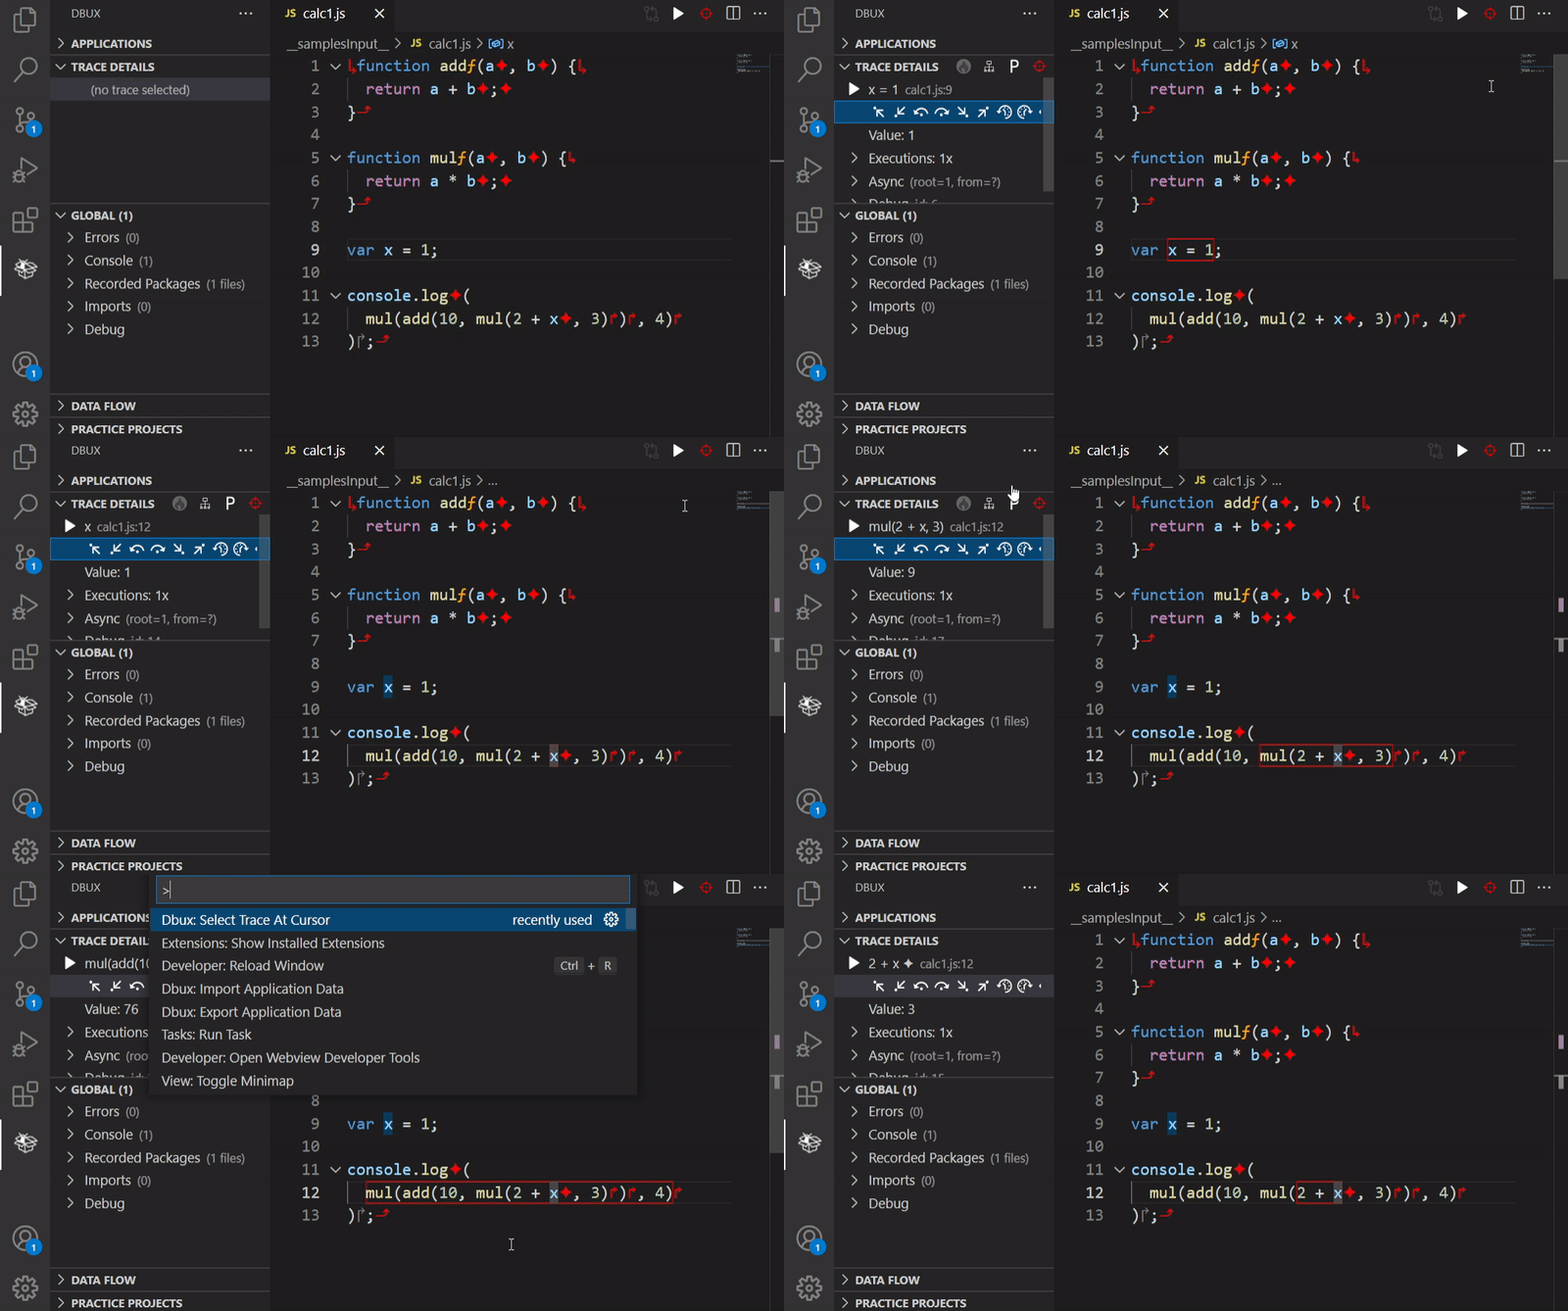
You can investigate a trace record (short: trace❔) of executed code using the "Select Trace" button:
- Place the keyboard cursor on a piece of code that has executed.
- You should see the red crosshair
show up in two places: the top right of the editor window and in the Trace Details View1.
- If there is no red crosshair, the selected code has not executed (or its execution has not been recorded).
- NOTE: Most executed code is decorated ↳ ↱ ↳ ƒ.
- Keywords like
ifandreturncannot currently be selected, however their conditions/arguments can.
- You should see the red crosshair
- Click the crosshair
or use the
Dbux: Select Trace at Cursorcommand to select. - Use repeatedly to select surrounding traces (as shown in the gif above).
Once a trace❔ is selected, the Trace Details View should offer a wide array of relevant information regarding the selected piece of code:

caution
A piece of code might have executed multiple times. Make sure you know which execution is selected before drawing conclusions.
- You might need to hover over the
Trace Details Viewfor buttons to show up. This is a limitation of the VSCode Extension API.↩