Trace Details View
After you selected a trace, you can inspect most of a trace❔'s relevant information in this view, e.g.:
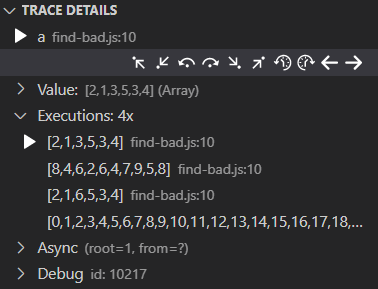
Values
If your currently selected trace is an expression with a value that is !== undefined, that value will be rendered here. You will see (no value or undefined) otherwise.
E.g.:
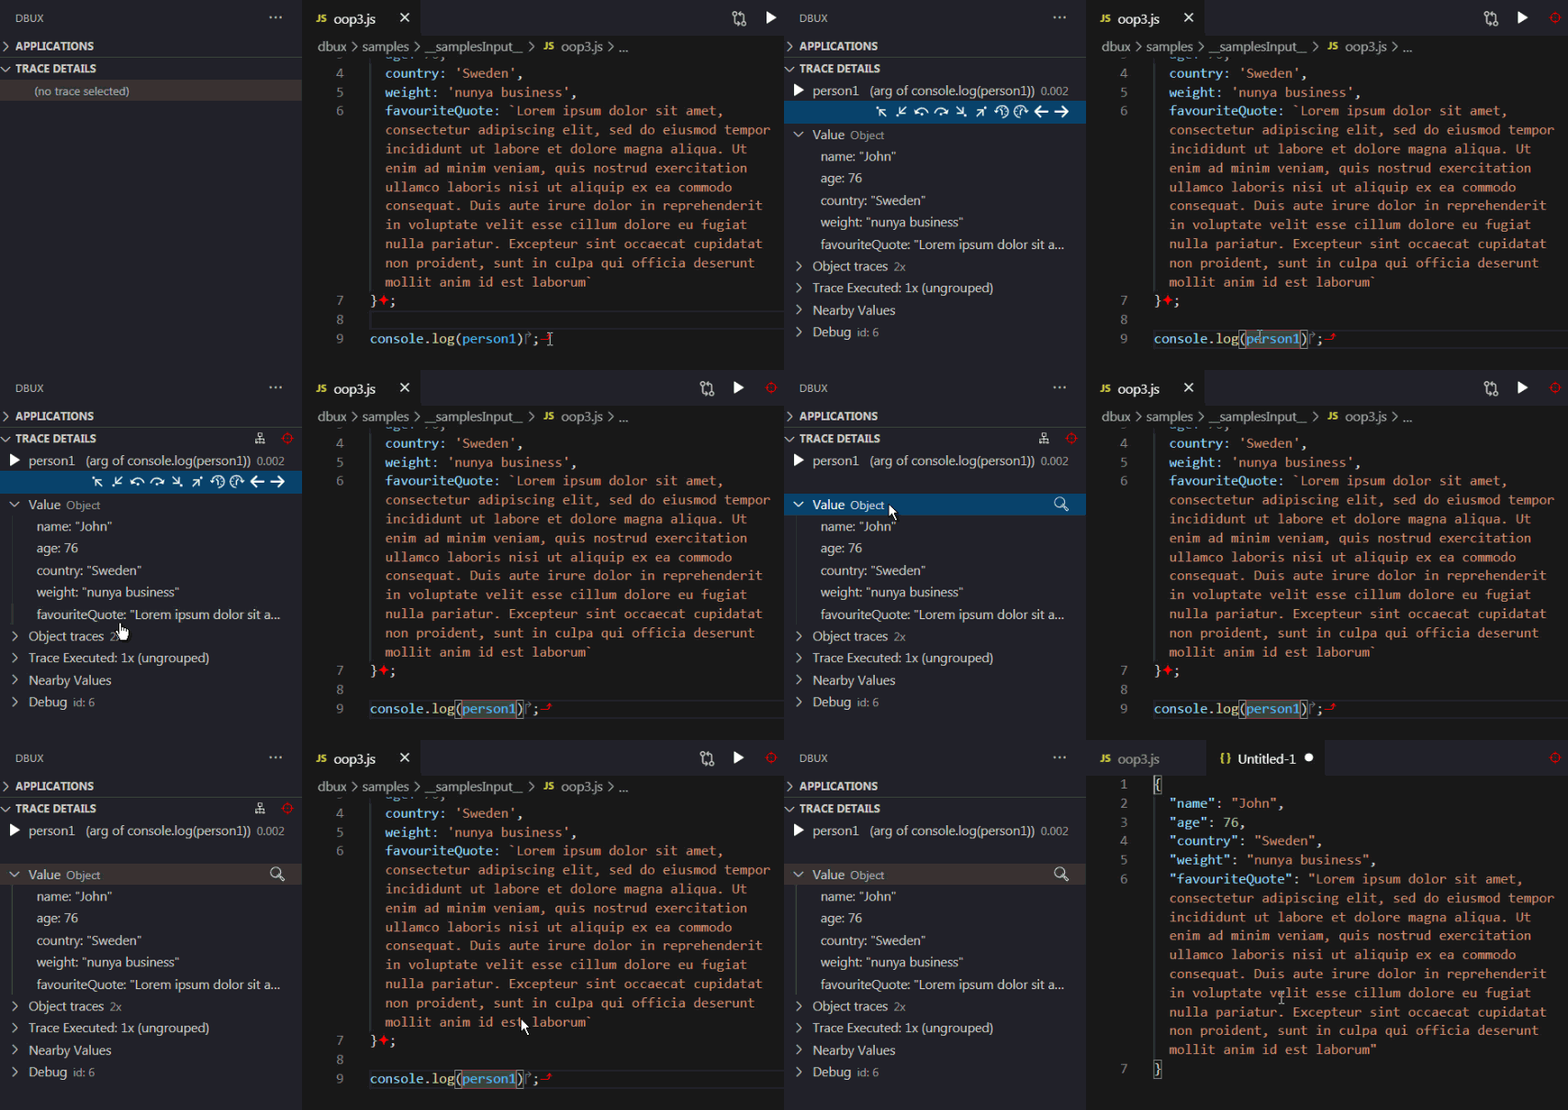
There are buttons to: (i) render the value in a new VSCode window and (ii) go to the value's origin trace (see Data Flow for more info).
Executions
A piece of code might have executed multiple times. The Executions node lists all of them. You can select them by clicking.
Another way of putting this is: Executions lists all traces of the currently selected trace's staticTrace❔.
Since this can be a lot of traces, you can group them by different criteria through the group button on the Executions node:
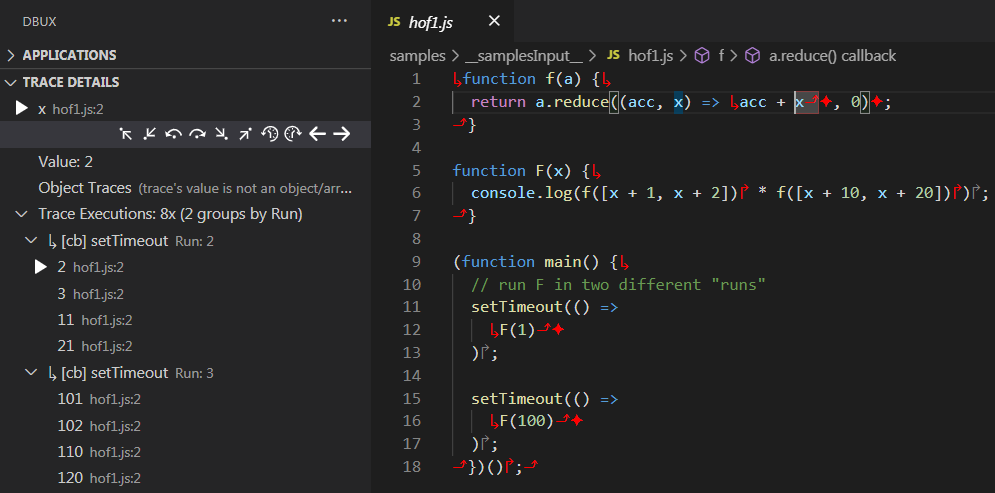
TODO(grouping categories + explanations)
tip
After selecting a trace, always first check how many executions are recorded and whether you are looking at the right one.
Navigation
The navigation buttons allow you to move between traces❔1:
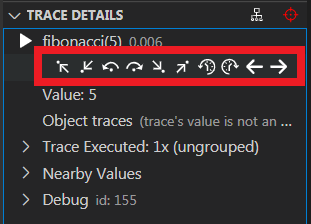

 Go to start/end of context
- Jump to the start/end of the current context❔ (function or file).
- When pressed again, steps out to caller (which we also call "parent").

 Go to previous/next function call in context
- Jump to previous/next traced function call (red ↱) before/after the currently selected trace.
- Note that library or native calls (gray ↱) are not traced and thus will be skipped by this button.
- When pressed again, steps into that function (aka context❔ aka "child context of this context").
- NOTE: Things might be a bit off in case of getters and setters
- Getters and setters work, but navigation is a bit less intuitive.
- Since getters and setters don't have a clearly identifyable caller trace, they will need some more development work before they will be fully smoothed out.

 Go to previous/next "non-trivial" trace in context.
- Jump to previous/next "non-trivial" trace in context❔.
- Stepping would be a lot of work, if we tried to step through every single expression.
- That is why Dbux uses some basic heuristics to ignore some of the more "trivial traces".
- Ex1: In case of
a.b, it will step toa.b, but it will not step toa. - Ex2: In case of
o.f(x, y);, it will step straight too.f(x, y), while ignoringo,o.f,xandy(all four of which are also all traced expressions, just a bit more "trivial" than the call expression itself).
- Ex1: In case of
- (Dev note: we internally determine "trivial traces" as traces of
TraceType.ExpressionValue.)

 Go to previous/next execution of the same trace
- If a piece of code was executed multiple times (because a function was called multiple times, or there is a loop etc), these buttons allow you to jump between the traces of those different executions.
- These buttons step through all traces of the currently selected
trace's staticTrace❔.

 Go to previous/next trace (unconditionally)
- Go to previous/next trace, no matter what. This navigation method does not filter out "trivial traces", and it also moves in and out of contexts, if that is where the previous/next trace is.
- These buttons provide the most granular navigation option.
- Recommendation:
- Only use these buttons for short distances, as there is usually a lot of trivial traces to step through, slowing navigation down a lot.
- These buttons help you follow the exact control flow of your program, visiting every expression and statement, not ignoring anything.
- Especially useful for convoluted one-liners or otherwise compressed, complex expressions and statements that are not intuitive to disentangle.
note
We are not debugging in real-time, but analyzing a previously recorded execution log, so we can:
- Step forward and also backward in time, meaning that all navigation modes exist twice (one forward, one backward).
- More easily (to some extent) take smarter (or: "slightly less stupid") steps than the default debugger. E.g. it automatically finds "the next context to step into" (and stops in front of it first, rather than jumping into it right away) etc.
Async
TODO: explain how this works in plain English.
NOTE: The details of this entry get rather technical. For now, we refer the avid reader to the Asynchronous Call Graph❔ section to explain what can be seen here.
Debug
The Debug node holds raw data, usually only used for debugging Dbux and advanced data analysis.
- You might need to hover over the corresponding views for navigation, group (and other) buttons to show up. This is a limitation of the VSCode Extension API.↩