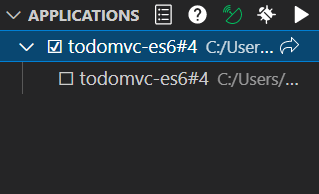
Application View
This view lists all recorded applications. Applications of the same entry point are grouped together:

You can use this view in several ways:
- Use the
button to the right of an application to go to its entry point.
- Click an application to enable/disable it.
- If an application is disabled (no checkmark), you cannot interact with it: its code is not augmented, its traces cannot be selected or searched, and it does not show up in the call graph.
- NOTE: Activating multiple applications at once can be useful for full-stack debugging purposes.
- When multiple applications are enabled at the same time, their call graph roots❔ are merged onto a single timeline, allowing their data to be inspected together.
caution
If your application does not show up here, you cannot analyze it. If that happens to you, please refer to our FAQ.
tip
This view is not crucial for most analysis tasks. We recommend minimizing it when you don't need it.