Global View
The Global View allows quickly navigating global events and their data, including:
Errors
Lists all detected errors in the program.
Errors are identified by interrupted stack frames or throw statements.
Each interrupted stack contributes one node to this list.
The nodes are the first (deepest) recorded interrupted frame.
The children of each node are all other interrupted stack frames on the same stack1.
If there are recorded errors, you can either look through the list or click the Error button to take you right to the recorded error location in code. From there you can investigate everything related to the error, including the error object itself, if it is available.
If there are multiple errors, you can click the button multiple times to toggle through all of them. The
Error button shows up in two places:
- At the top right in VSCode (to the right of the editor tabs).
- At the top of the
Globalview.
caution
This is currently WIP, but should be done soon (TM).
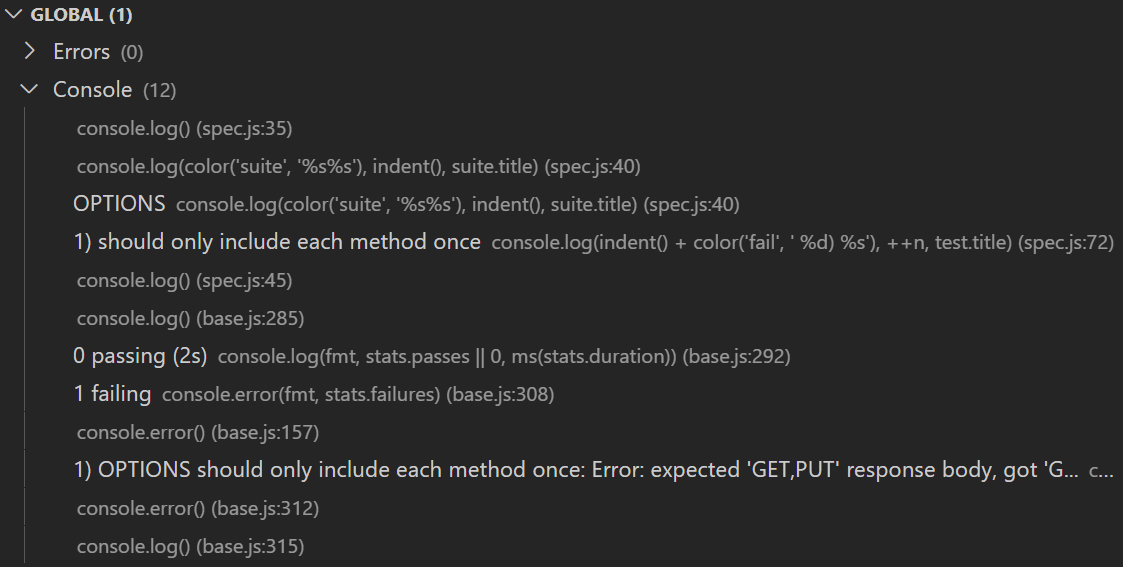
Console
Lists console output events, such as console.debug, console.log, console.warn, console.error etc.
Clicking each event takes you to the code where the event was recorded.

tip
Hover over each node to see the complete message, as well as the code that triggered it and its location.
Modules
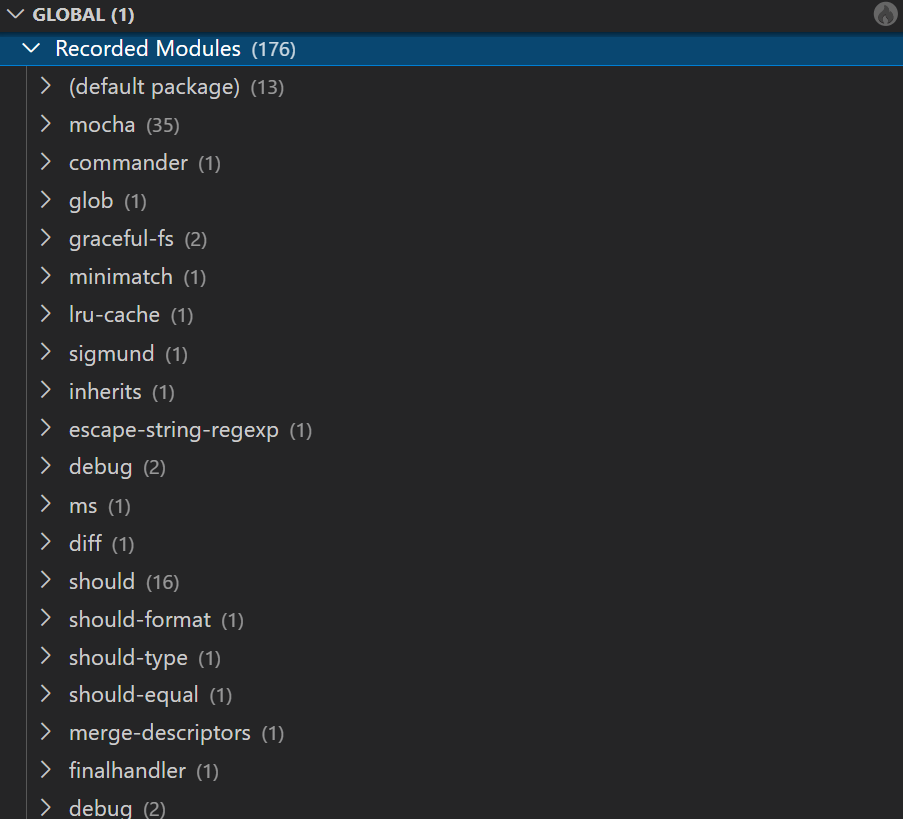
Lists all executed packages and all their executed files/modules/script-tags.
(application)contains the application's own files (i.e. files not innode_modules).- Packages and files are (by default) ordered by first time of execution (except for "
(application)").

note
The above screenshot features the debug package twice. That is because the application loaded debug from two different places (more info here). Often times, this is not going to cause any trouble, but it has the potential to cause dependency conflicts or otherwise defeat assumptions about third-party dependencies to be of a specific version and be loaded from a specific place. Dbux can help discover these types of issues.
Debug
The Debug node holds raw data, usually only used for debugging Dbux and advanced data analysis.
- We introduced (rough) specs of the
GlobalErrorsNodein https://github.com/Domiii/dbux/issues/618↩