Call Graph 
The call graph serves as a "map of your runtime execution": it provides a bird's eye overview of all file and function executions.
Why do we need a Call Graph?
An interactive call graph allows investigating the control flow of your application. For example, it lets you:
- Identify all asynchronous events❔ and their connections.
- Visualize recursion trees.
- ...and more...
As an analogy, the call graph can be seen as a high-level "Map" while the trace details view is a low-level "Street View" of our applications' execution. Together, they offer a multi-resolutional interactive tool to investigate control flow and many other aspects of runtime behavior.
Synchronous Call Graph
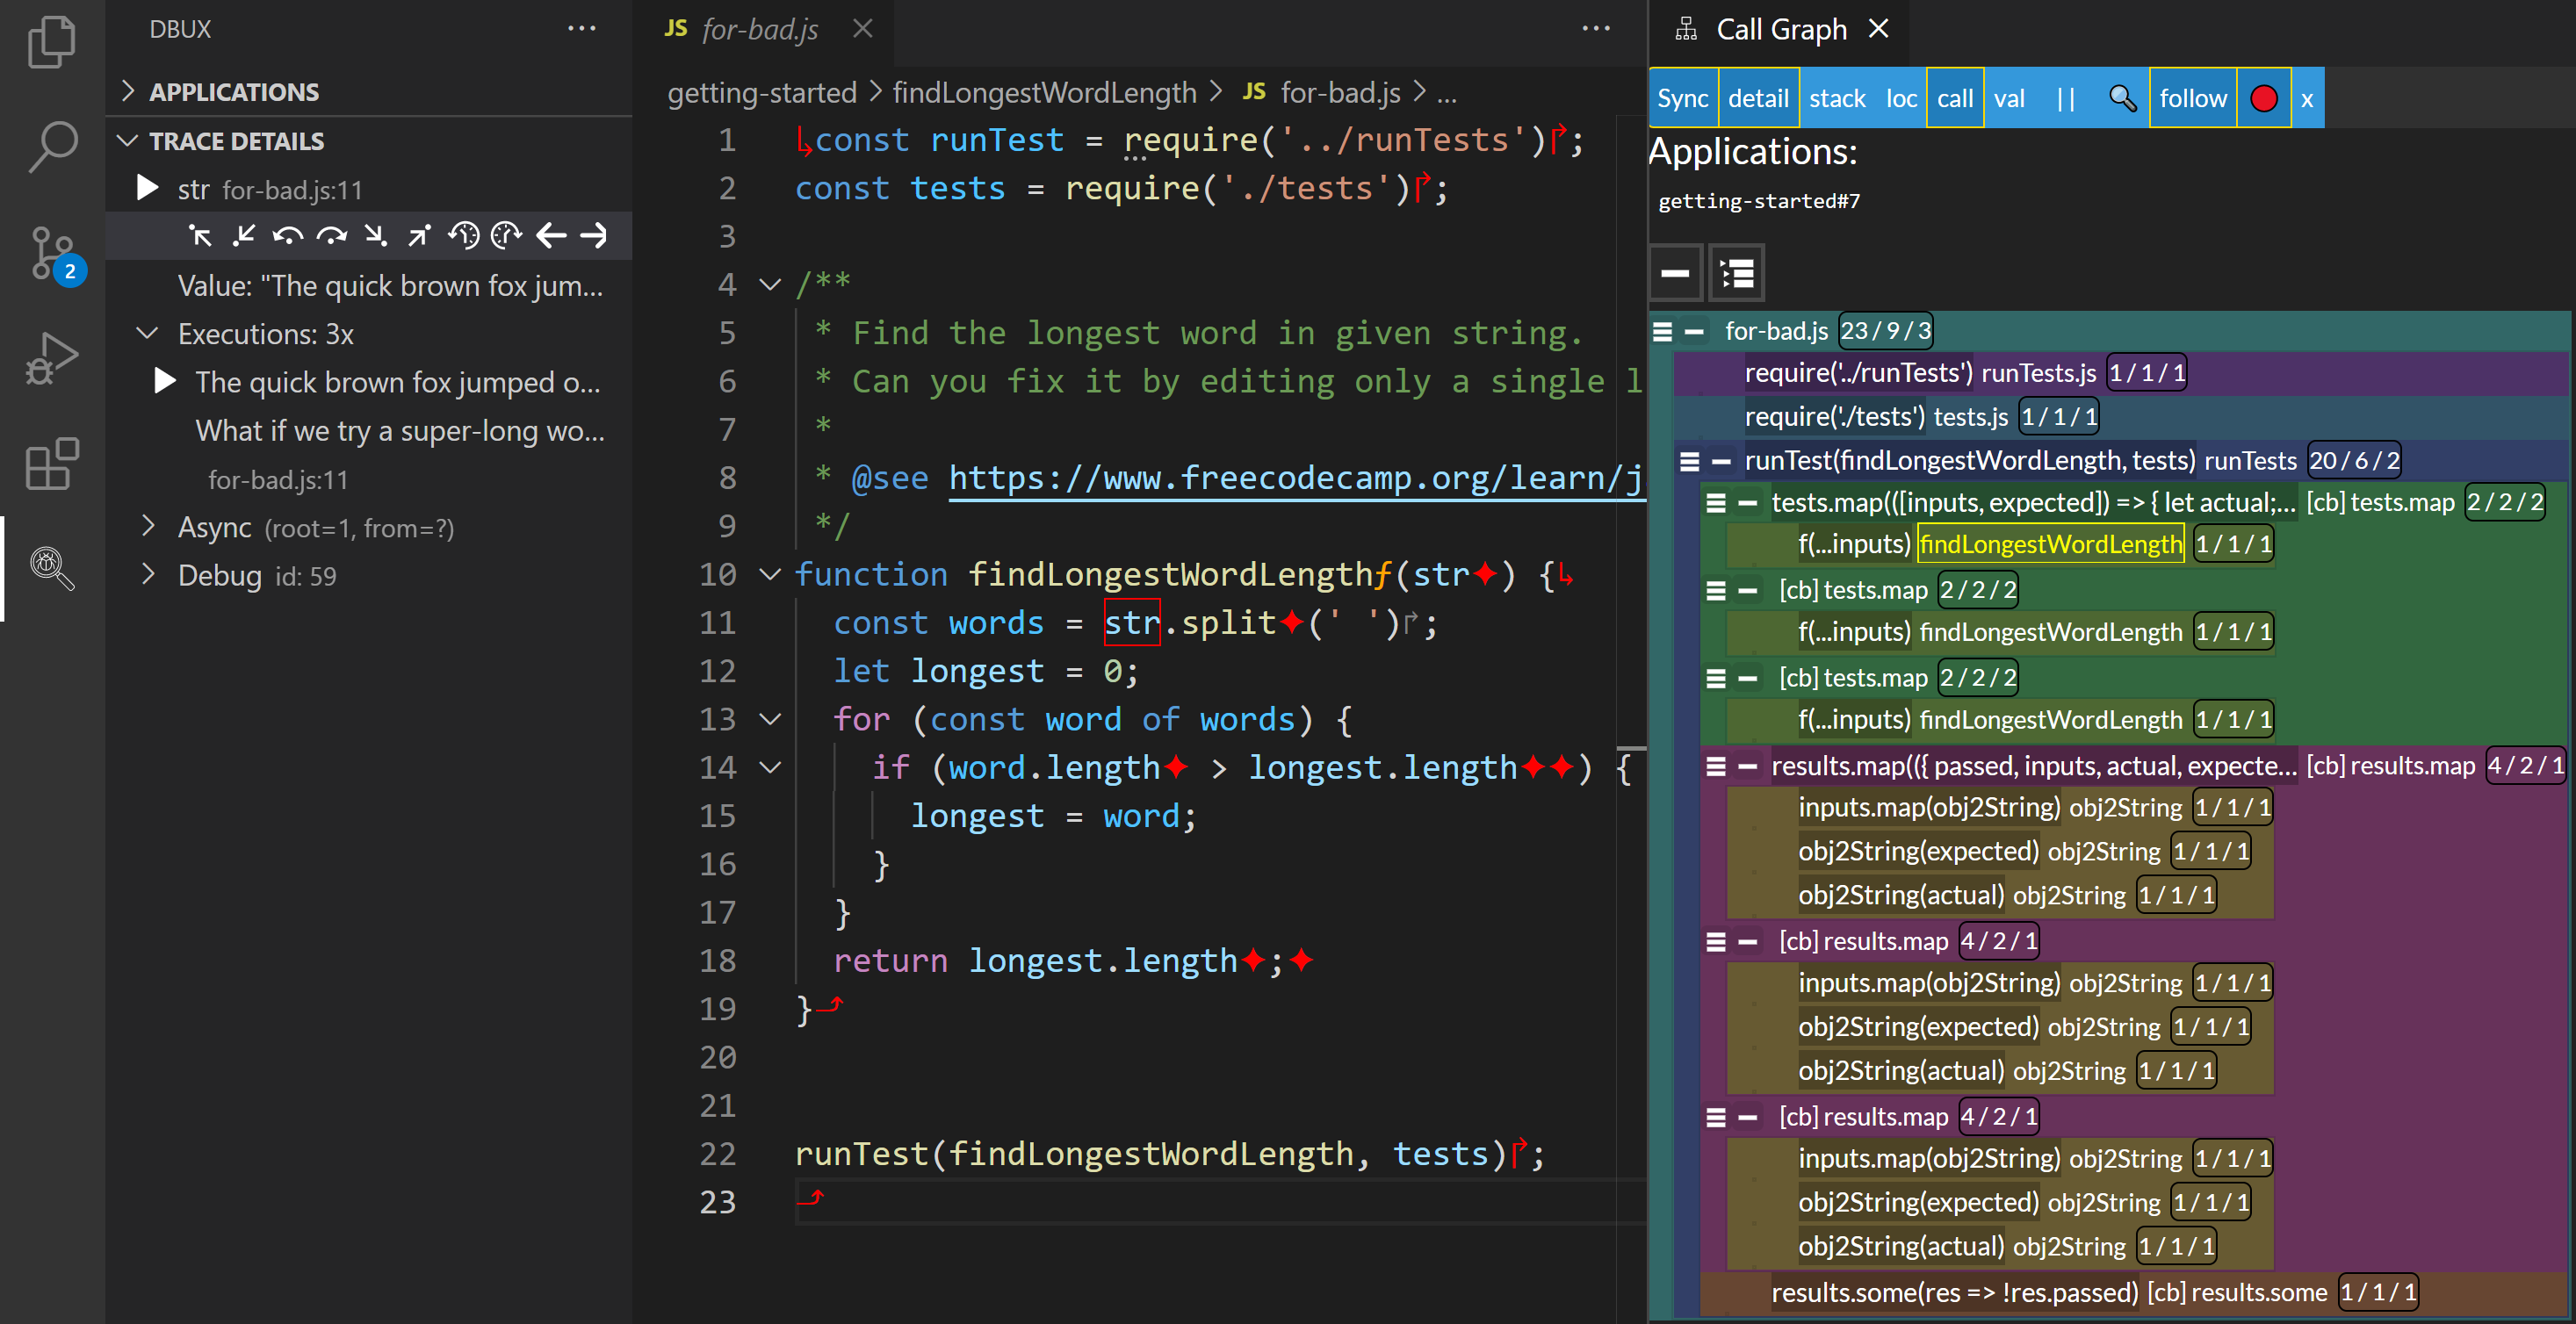
When investigating an application without any asynchronous events❔, the call graph is best viewed in Sync mode.
The synchronous call graph has the following properties:
- Roots: By default, the synchronous call graph shows a list of all root nodes (or "call graph roots❔" or "CGRs"): the entry point of the application, as well as the starting point of any asynchronous event❔, vertically sorted by time of recording (later is lower).
- Nodes: CGRs❔ can have children and entire subtrees. Each child node represents the execution of a file or function that was called by its parent node. Conventionally, each node is referred to as a "stack frame", but we felt that that terminology is confusing in the context of the more general call graph. We usually refer to these nodes as contexts❔ instead.
- Real-time: The call graph updates in real-time. A new CGR❔ is added to the graph, for each newly recorded asynchronous event.
Non-empty nodes have two of three buttons to their left in order to expand and collapse children and/or entire subtrees.
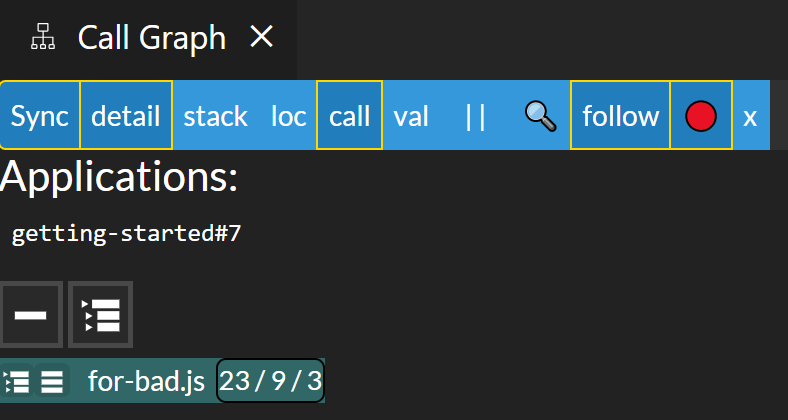
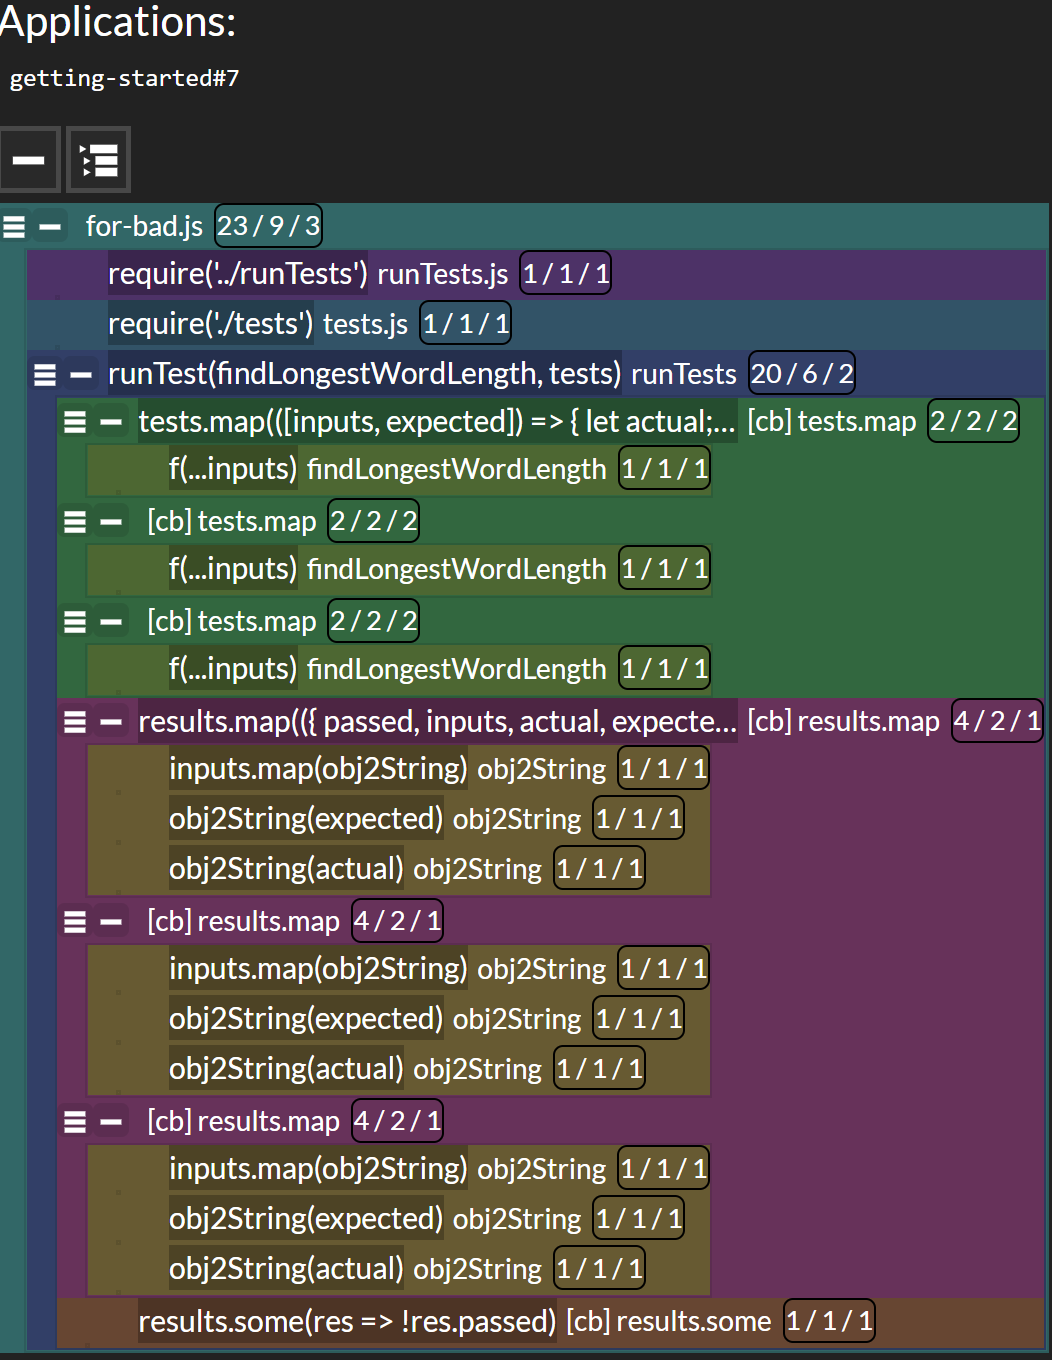
Above screenshots: (1) the call graph has a single collapsed root. (2) The entire subtree is expanded.
Asynchronous Call Graph
In Async mode, the call graph becomes the asynchronous call graph (short: ACG), which is explained on the next page.
Call Graph vs. Call Stack
The call stack is the list of all stack frames at a current point in time. That means: all executed functions that have not yet concluded and are not currently suspended?. While useful, the call stack only represents a small fraction of our application. In fact, the call stack can be defined as a slice of the call graph during its depth-first traversal, at a specific point in time.
Example 1: fibonacci graph vs. stack
Example: The following screenshot shows call graph and stack of fibonacci(6).
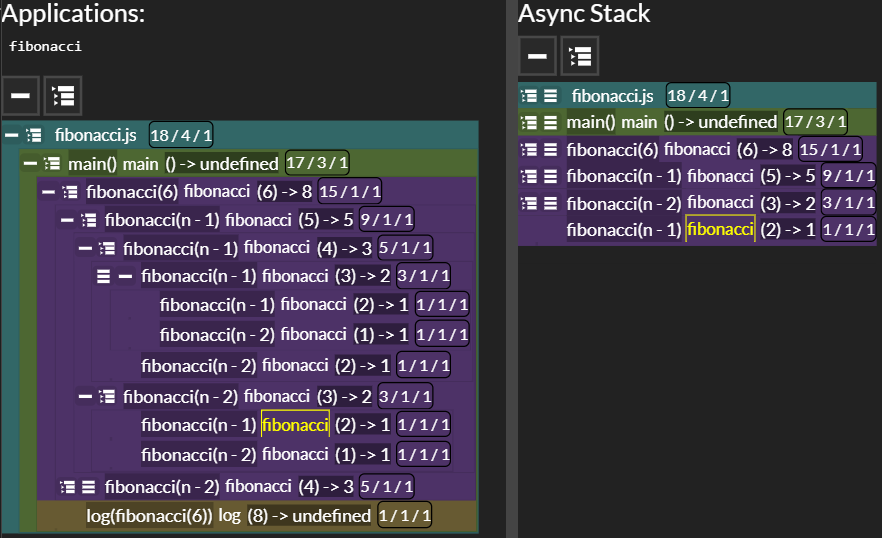
- The stack is shown on the right.
- The call graph (left) also reveals the (non-asynchronous) stack (nested toward the right). You can find all stack frames by going up the parents from the selected node in the graph.
- In this recursive example, the call graph also serves as recursion tree.
Example 2: sequelize stack
Lack of a proper asynchronous call stack (ACS) has been frequently lamented by developers1. That is why Dbux offers a dedicated call stack view. In Example 1, the call stack can be relatively easily understood from the call graph view alone. But there are many scenarios where a dedicated call stack view is still necessary, especially in case of long-winded, asynchronous control flows.
For example, sequelize issue #8199 demonstrates how inadequate support for asynchronous execution in modern JavaScript engines and debuggers asynchronous execution is a real concern. If an error arises, the developer has no easy way of finding the sequelize call that caused it because the execution stack is missing asynchronous nodes. The Dbux call stack attempts to address that issue:
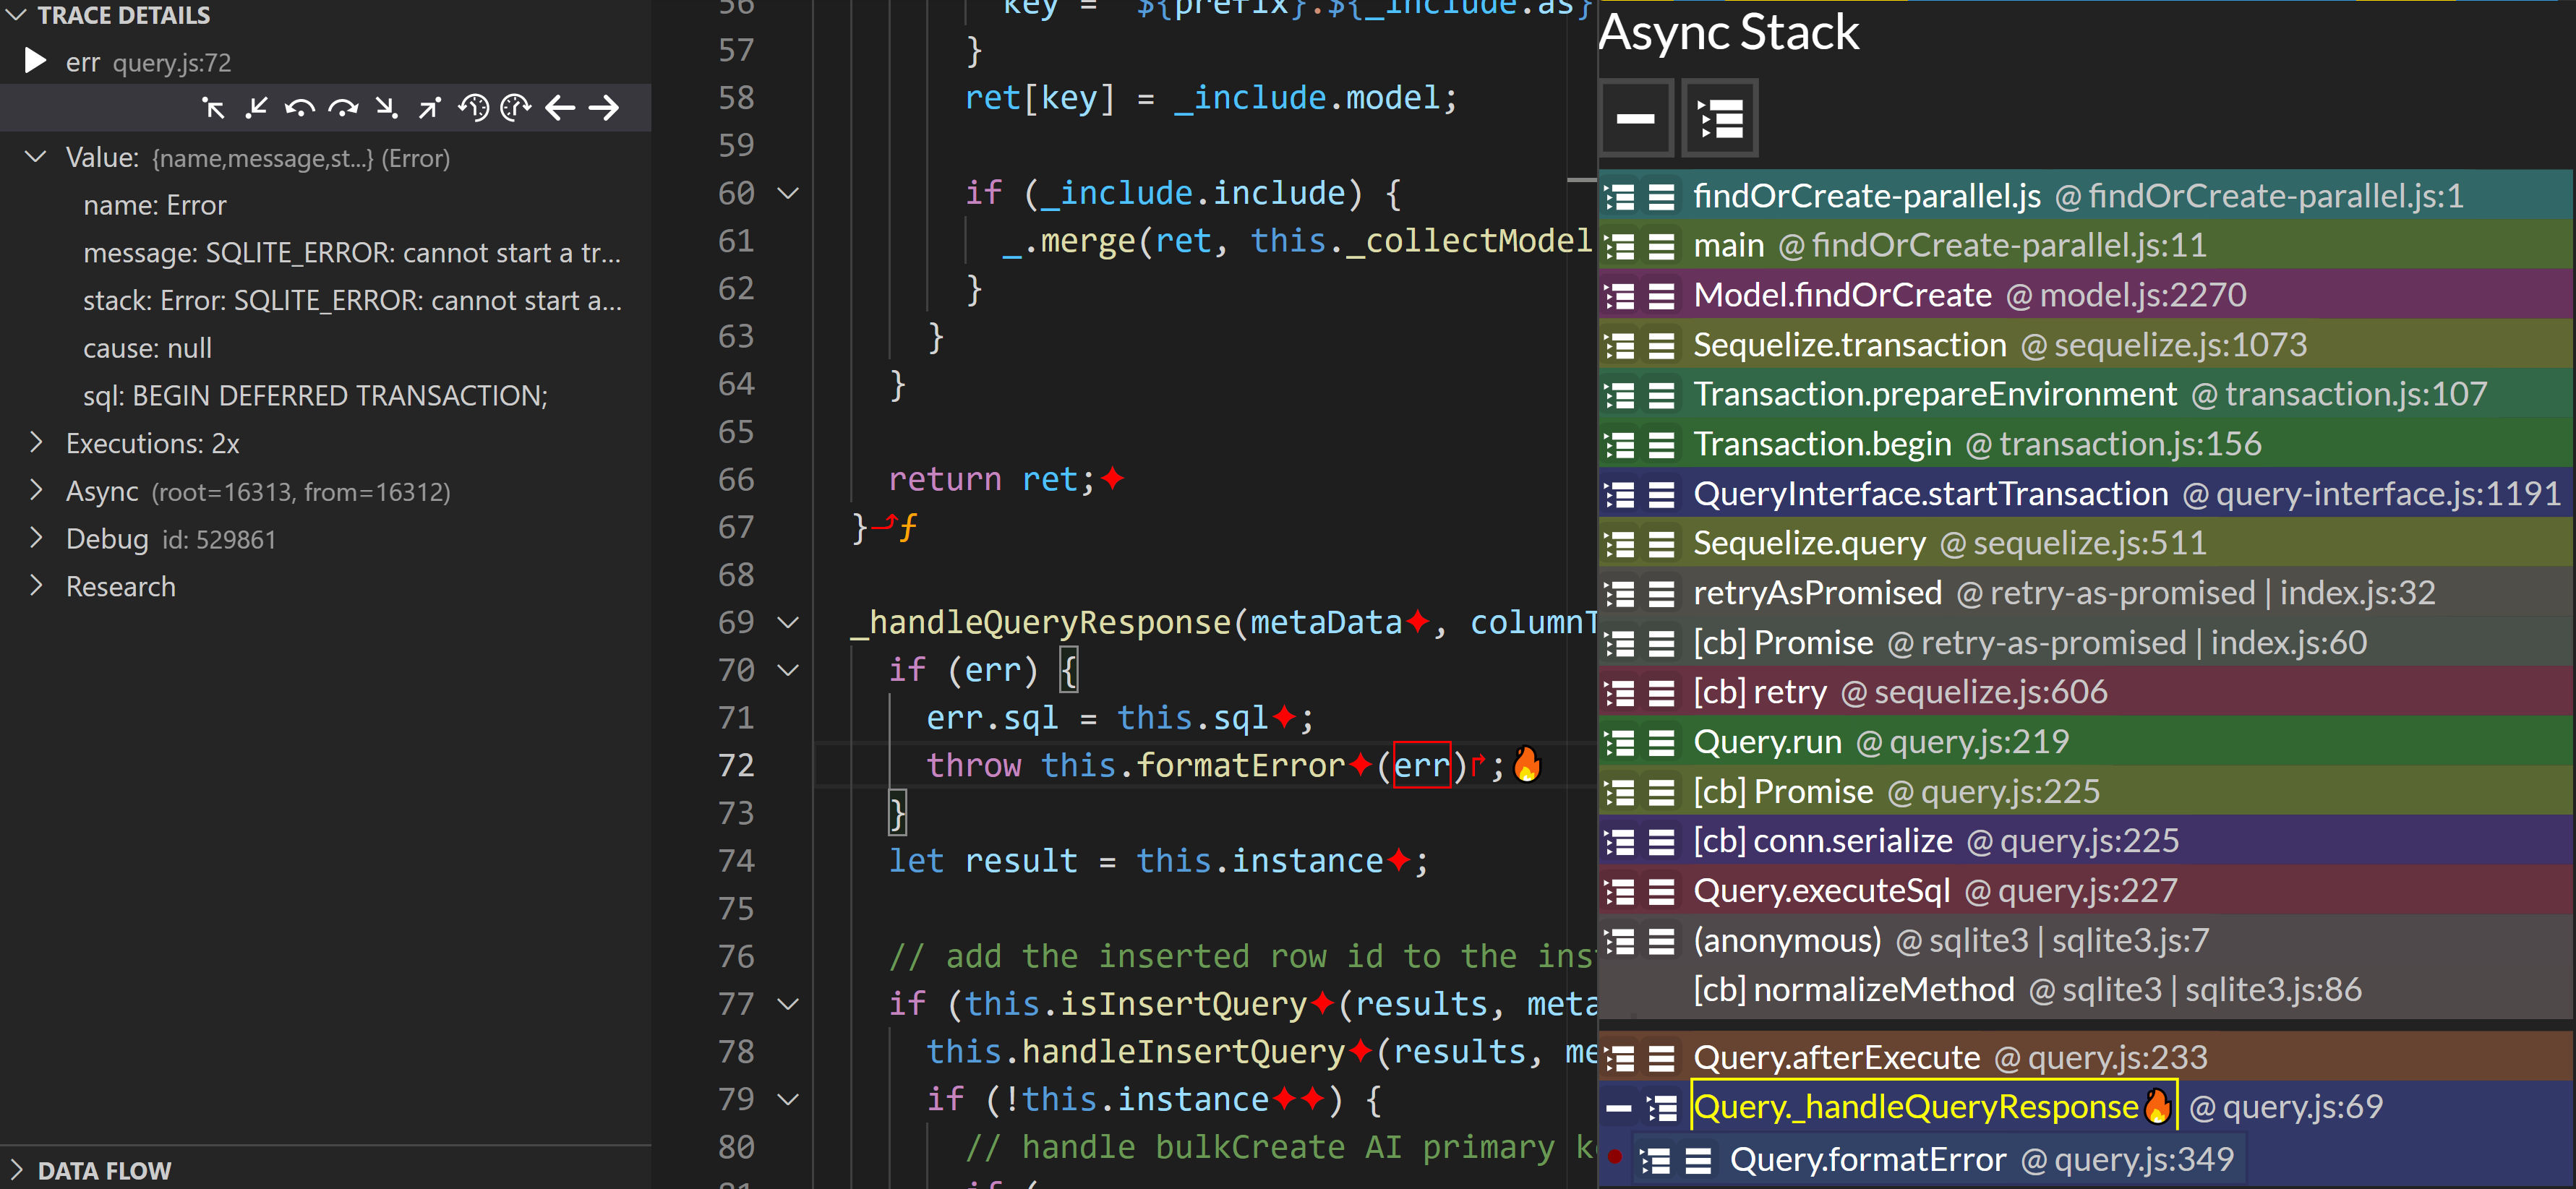
Above screenshot shows the asynchronous call stack of an Error captured when executing sequelize's findOrCreate.
Note that the method called by the user Model.findOrCreate is prominently displayed near the top of the stack.
Toolbar
The toolbar allows changing how the call graph is displayed.
Sync/Async Mode Toggle
Toggles between Sync and Async mode.
detail
Async: In async mode, disabling details visually compacts the graph. This is used to better expose high-level patterns between CGRs❔. One can better see the "big picture" by disabling details and then zooming out.
Sync: details currently does nothing in Sync mode.
stack
Toggles the asynchronous stack.
loc
Show/hide locations in context nodes.
call
Sync: Show/hide caller traces of all contexts that are function invocations. This allows to quickly understand how a context node ("stack frame") was called.
val
Show/hide value in context nodes.
Sync: In synchronous mode, it shows (arguments) -> returnValue of the context's call expression.
Async: In asynchronous mode, it shows the value of the first trace of the currently selected trace in each root. Among other uses, this allows you identifying the roots that executed the selected trace's code and what the value of that root was. This in turn can be used to better understand the main purpose of different roots, if the right trace is selected. (TODO: examples)
thin mode
Sync: Enable to render a horizontally more compact graph.
Async: Does not do anything in async mode currently.
🔍 search
→ See the search section for more information.
follow
When follow mode is activated, the call graph always zooms in on the call graph node of the currently selected trace.
pause/resume/clear
These features let you isolate the part of the call graph responsible for executing specific events (such as clicking a buggy button), while removing (hiding) all kinds of unrelated clutter.
🔴 pause/resume
Use the 🔴 button to pause/resume the rendering of new incoming data, so we can focus on what we already have. This is useful to prevent cluttering the call graph with events that get recorded once we have recorded the bug (or other event of interest).
For example, when investigating a bug that happens after pressing some button (a "buggy button" if you will) in your application, you can:
- Wait for the application to finish initialization and for the "buggy button" to show up.
- Press
x. - Press a buggy button.
- (if necessary) Wait until the bug occurs.
- Press 🔴 (pause).
caution
You might be tempted into thinking that pausing with this button will stop all recording, however that is not what happens. Currently, Dbux keeps on recording for as long as the application is running. This button only hides that new data behind a single "Hidden Node". That inability to completely pause recording, can make things very slow and thus make debugging of games and other kinds of high performance applications very difficult. You can read more about performance considerations here.
x Clear (show/hide already recorded traces)
The clear button (x) is useful for removing clutter when investigating a bug that does not appear immediately, or is not part of the initialization routine.
Call Graph Colors
Node colors are assigned pseudo-randomly. Same color means same staticContext❔ (same function/file).
Call Graph Implementation Details
A few more notes on the Call Graph GUI implementation:
- The Call Graph is implemented as a VSCode WebView.
- Inside of
dbux-code, the graph is defined in dbux-code/src/webViews/graphWebView.js
- Inside of
- The Call Graph consists of three modules:
- Client and host are running in separate runtimes. They share the
graph-commonmodule.- For a better call graph experience, we developed an IPC-first component system to easily render things on the client, while allowing us to control it from the host. Its implementation can be found in the three modules'
src/componentLibfolders. - Theoretically, the client can also be rendered independent of VSCode, on a website, in an iframe etc.
clientandhostcommunicate via aIpcAdapterwhich must provide two functions (whose implementation depends on the environment that they run in):onMessageandpostMessage.- The custom client would require its own
IpcAdapterimplementation.dbux-code's can be found in dbux-code/src/codeUtil/WebviewWrapper.js.
- For a better call graph experience, we developed an IPC-first component system to easily render things on the client, while allowing us to control it from the host. Its implementation can be found in the three modules'